Reggio Emilia, IT ·

Riccardo Bedogni

AI Engineer · Data & ML

I build systems that find what's similar — and measure whether they're right.

Trajectory

Computer science by training, applied AI by trade. The thread running through it is data that has to be matched, retrieved or predicted, and the question of how you know the answer is right.

  1. May 2021

    Software Developer Intern

    Max Mara Fashion Group · Reggio Emilia

    A Flask web app to track how time is spent across business projects: relational schema, business logic and the KPIs for time efficiency.

  2. Sep 2022

    BSc in Computer Science

    University of Modena and Reggio Emilia

    Scienze e Tecnologie Informatiche, completed in July 2025.

  3. Mar 2025

    AI Engineer Intern

    OT Consulting · Reggio Emilia

    A predictive system for the success potential of new business projects: scikit-learn model, an LLM layer that writes readable reports, served with FastAPI. Analysis time went from hours to minutes.

  4. Jun 2025 →

    Software Developer & AI Engineer

    OT Consulting · Reggio Emilia

    Python backend services and REST APIs for enterprise clients, full-stack features in Vue.js, SQLAlchemy and MySQL, ML and AI integrated into client projects, and a legacy app migrated to Google Cloud.

  5. Dec 2026

    MSc in Computer Engineering

    University of Modena and Reggio Emilia

    Data Engineering & Analytics track, started in September 2025. Graduation expected in December 2026.

Work

Six projects, each with its evaluation and its limits written down. The numbers come from the repositories, not from memory.

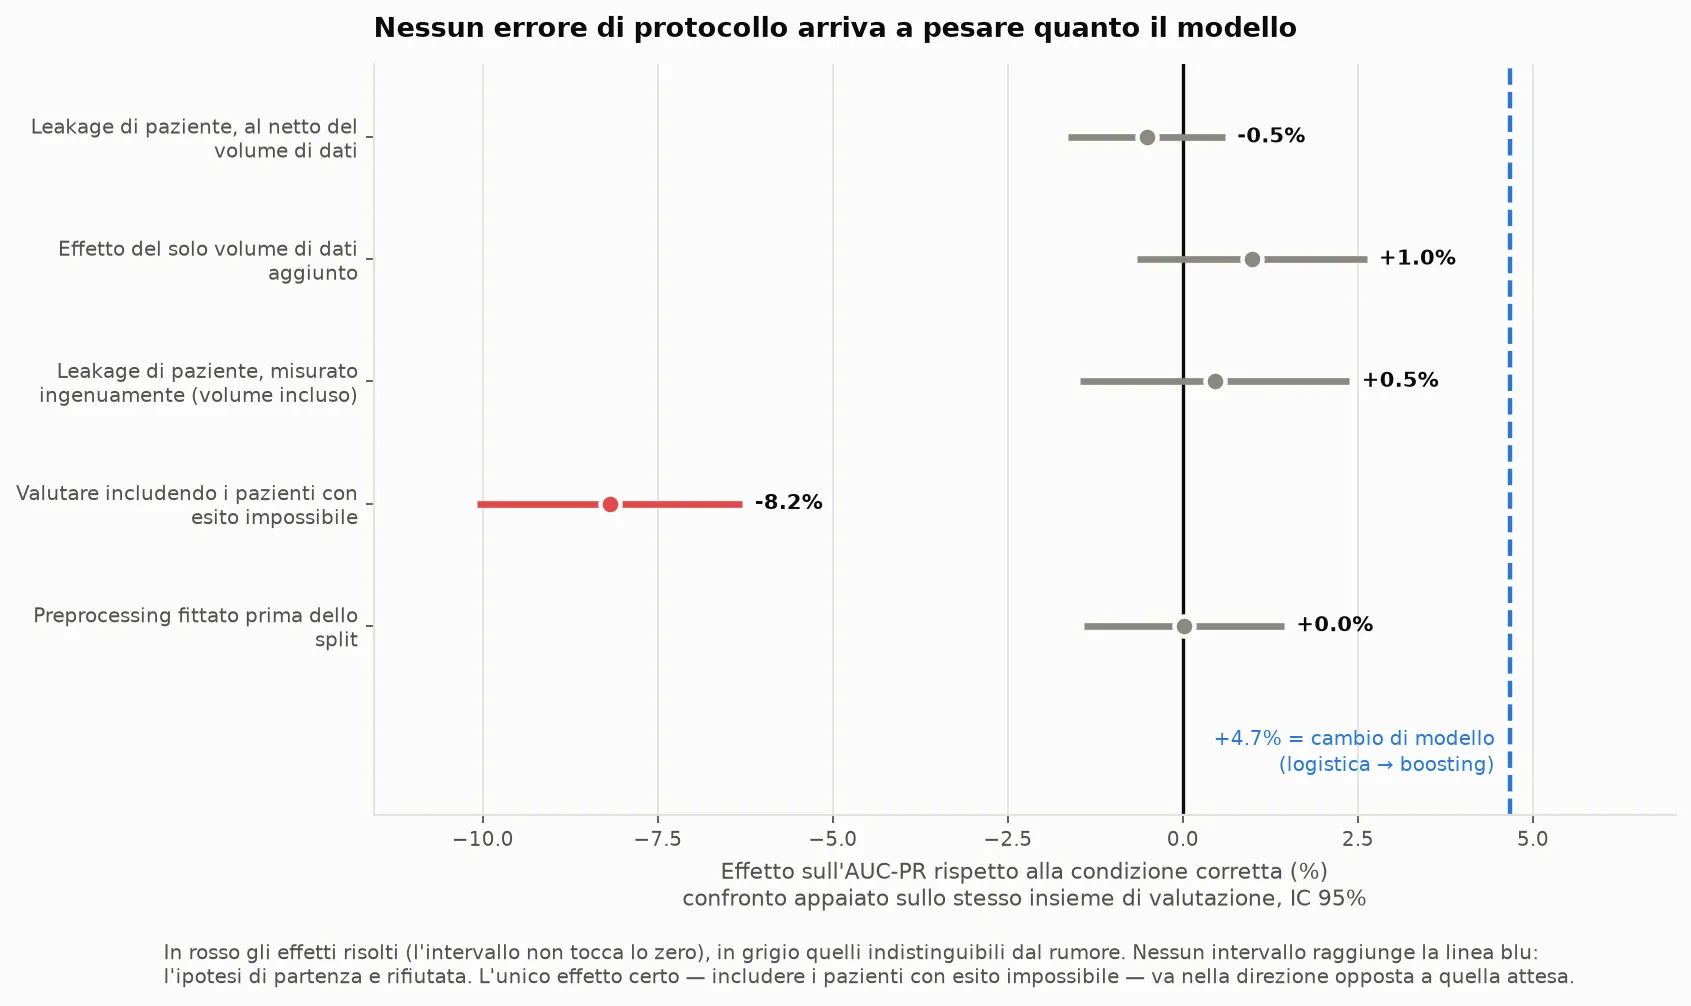
Paired comparison of protocol errors on AUC-PR with 95% confidence intervals. Only one effect is resolved (−8.2%), and none reaches the +4.7% gained by changing model.

Machine learning · Methodology

30-day readmission in diabetic patients

An end-to-end clinical ML pipeline, plus an experiment asking whether the validation protocol matters as much as the model. It doesn't, and the negative result is the most useful thing the project produced.

AUC-PR on test (prevalence 0.114, lift 2.02×)
0.230
readmissions caught in the top-10% risk group
24.3%
  • Python
  • scikit-learn
  • pandas
  • SHAP

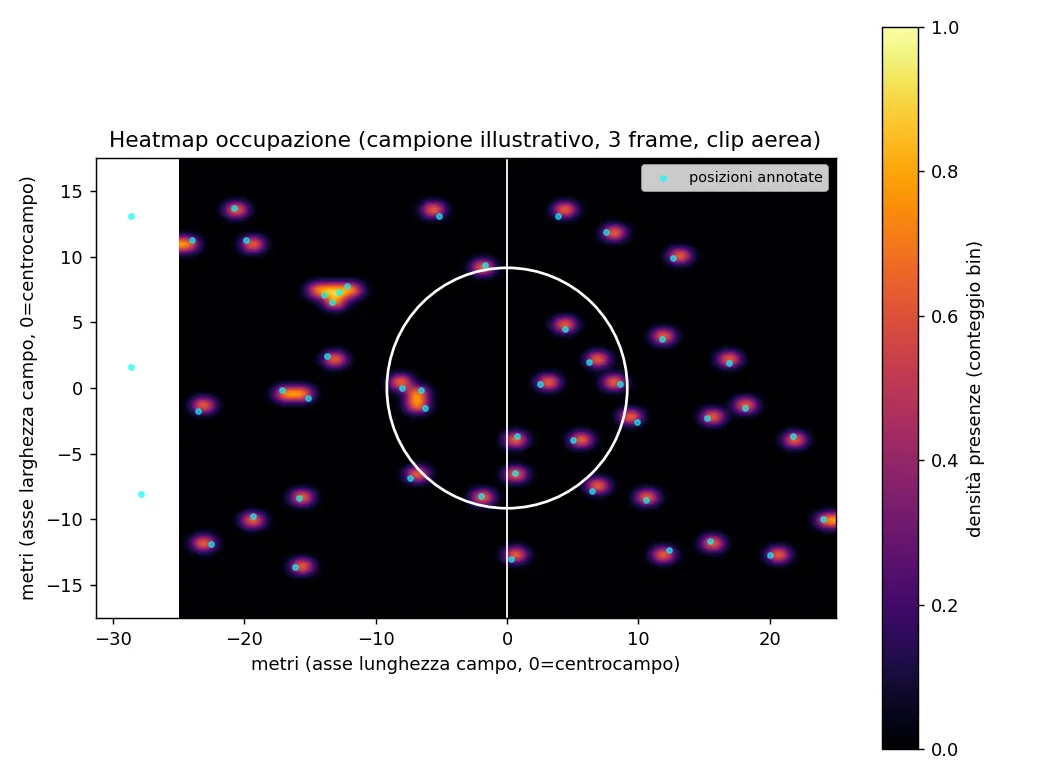
Occupancy heatmap on a bird's-eye view of the pitch around the centre circle, built from manually annotated positions on three frames of an aerial clip.

Computer vision

Tactical Football

A computer-vision pipeline for football, from detection and tracking to team assignment, pitch calibration and a bird's-eye view, with each stage measured against hand-made ground truth.

team assignment accuracy (32/35)
0.914
on an Apple M4 (source clip: 25 FPS)
~30 FPS
  • Python
  • YOLOv8
  • ByteTrack
  • supervision

Data integration · University project

Taxonomy-aware schema matching on OMOP-CDM

A university project on data integration. When clinical codes are slightly wrong, exact matching misses columns that clearly belong together. A similarity built on the SNOMED hierarchy recovers them.

  • Python
  • pandas
  • Valentine
  • OMOP-CDM

IoT · Computer vision · University project

Smart Parking Premium

A parking digital twin. A webcam over a paper mock-up updates each slot's state in real time, and a Telegram bot, GPS-based barrier logic and B2B federation are built on top.

Machine learning · Explainability

HR attrition analytics

Why do employees leave? Feature engineering on badge logs, six classifiers compared, and SHAP to turn the model into actions for HR.

Coming soon Visualisation · RAG

RAG Pipeline Visualizer

An animated view of a RAG pipeline, from query to chunks, scores, reranking and answer, with a live backend and a replay mode to step through a run.

Demo link coming soon

Research

University project · Schema matching & data integration

Two hospitals, one patient, slightly different codes.

Hospitals store the same kinds of information in different databases, with different column names. To combine them you first need to know which column in one corresponds to which in the other. That is schema matching. A common way to do it is to look at the values: if two columns contain the same things, they probably mean the same thing.

Clinical data makes this harder. Diagnoses are stored as codes from huge medical vocabularies, and real-world coding errors are rarely random. Someone records "chronic kidney disease, stage 5" when it was stage 4: a neighbouring concept, not a typo. To an exact comparison those two are as different as "kidney disease" and "broken arm".

The project treats the vocabulary as what it is, a hierarchy. Two codes are similar if they are close in that tree. I built a way to generate realistic near-miss errors on OMOP-CDM data and a matcher that compares values by meaning instead of by spelling, then measured both against exact matching on the Valentine benchmark framework.

The code behind it →
Method

How I approach a data or ML problem. These aren't rules I read somewhere: each one comes from a mistake I made or caught in my own projects.

  1. Decide what "right" means first

    Pick the metric from the decision it supports, before touching a model. With 11% positives, accuracy rewards doing nothing, so in the readmission project the metric is AUC-PR and the threshold comes from expected cost.

  2. Look for the silent errors in the data

    The expensive bugs don't crash. A "None" that means "test not ordered", patients who cannot be readmitted, a parser that quietly returns 114 units instead of 586. I look for them before I train anything.

  3. Build the weak baseline

    A simple baseline tells you what the clever part is worth. In the RAG project it showed that retrieval and final accuracy come apart, which I would have missed otherwise.

  4. Measure the claim, not the vibe

    Paired comparisons, confidence intervals, held-out probes for thresholds. If a design can't answer the question, change the design. That's how "the protocol matters" turned into a rejected hypothesis.

  5. Write the limits next to the results

    Every project ends with what it can't do. A recruiter reading a negative MOTA deserves the explanation in the same place as the number.

How I use AI at work

I use Claude Code every day as a pair programmer: to read unfamiliar code, scaffold the boring parts, write tests and challenge my reasoning. I keep the decisions: what to build, what to measure and when something is wrong.

Concretely, that means small reviewed diffs instead of big generated dumps, asking for the failure cases explicitly, and verifying numbers against the source rather than trusting a summary. This site was built that way too, with every figure checked against the repositories.

  • AI speeds up the typing, not the judgement.
  • If I can't explain a line, it doesn't ship.
  • Evaluate LLM features like any other model.

Toolkit

What I use in my projects and at work.

Languages
  • Python
  • JavaScript
  • SQL
  • Java
  • C++
  • HTML & CSS
ML & Data
  • scikit-learn
  • pandas
  • NumPy
  • XGBoost
  • SHAP
  • PyTorch
  • Ultralytics YOLO
  • OpenCV
  • ByteTrack
Retrieval & LLMs
  • RAG
  • Sentence Transformers
  • ChromaDB
  • BM25
  • Cross-encoder reranking
  • LangChain
  • Claude API
  • OpenAI API
  • Gemini
Backend & databases
  • FastAPI
  • Flask
  • REST APIs
  • SQLAlchemy
  • Pydantic
  • MySQL
  • SQLite
  • BigQuery
Frontend
  • Vue.js
  • Streamlit
  • Node.js
  • Astro
Cloud & tools
  • Google Cloud (Cloud Run
  • Cloud SQL)
  • Git
  • Linux & Bash
  • pytest
  • Jupyter
  • LaTeX
  • Claude Code
  • Agile / Scrum

Contact

Let's talk about data that needs to make sense.

Open to conversations about AI engineering and data/ML roles, research collaborations, or a project you'd like a second pair of eyes on.